Week 3 — ML Experiment Management and Workflow Automation & MLOps Methodology
ML Experiments Management and Workflow Automation
Experiment Tracking
The need for rigorous processes and reproducible results, creates a need for experiment tracking.
Why experiment tracking?
- ML projects have far more branching and experimentation
- Debugging in ML is difficult and time consuming
- Small changes can lead to drastic changes in a model's performance and resource requirements.
- Running experiments can be time consuming and expensive
What does it mean to track experiments?
- Enable you to duplicate a result
- Enable you to meaningfully compare experiments
- Mange code/data versions, hyperparameters, environment, metrics
- Organize them in a meaningful way
- Make them available to access and collaborate on within your organization
Simple Experiments with Notebooks
- Notebooks are great tools
- Notebook code is usually not promotes to production
- Tools for managing notebook code
- nbconvert (
.ipynb→.pyconversion) - nbdime (diffing)
- jupytext (conversion+versioning)
- neptune-notebooks (versioning+diffing+sharing)
- nbconvert (
Smoke testing for Notebooks
Not Just One Big File
- Modular code, not monolithic
- Collections of independent and versioned files
- Directory hierarchies or monorepos
- Code repositories and commits
Tracking Runtime Parameters
Config files
The parameters value can be tracked along with other code files
data:
    train_path: '/path/to/my/train.csv'
    valid_path: 'path/to/my/vaild.csv'

model:
    objective: 'binary'
    metric: 'auc'
    learning_rate: 0.1
    num_boost_round: 200
    num_leaves: 60
    feature_fraction: 0.2
or in Command line
But this requires additional code to be save these values and associate them with the experiment. This is an additional burden but it also makes those values available for analysis and visualization rather than having to parse them out of specific commit.
python train_evaluate.py \
    --train_path '/path/to/my/train.csv' \
    --valid_path 'path/to/my/vaild.csv' \
    --objective 'binary' \
    --metric 'auc' \
    --learning_rate 0.1 \
    --num_boost_round 200 \
    --num_leaves 60
    --feature_fraction 0.2
Log Runtime Parameters
Example of what the code to save the runtime parameters where we're setting runtime parameters from command line.
parser = argparse.ArgumentParser()
parser.add_argumnet('--numeber_tress')
parser.add_argument('--learning_rate')
args = parser.parse_args()

neptune.create_experiment(params=vars(args))
...
# experiment logic
...
Tools for Experiment Tracking
Data Versioning
- Data reflects the world, and the world changes
- Experimental changes include changes in data
- Tracking, understanding, comparing, and duplicating experiments includes data
Tools for Data Versioning
- Neptune
- Pachyderm
- Delta Lake
-
Git LFS
-
Dolt
- lakeFS
- DVC
- ML-Metadata
Experiment tracking to compare results
- As you gain experience with the tools, you'll get more confortable
- Log every metric that you might care about
- Tag experiments with a few consistent tags which are meaningful to you
Example: Logging metrics using TensorBoard
logdir = "logs/image" + datetime.now().strftime("%Y%m%d-%H%M%S")

tensorboard_callback = keras.callbacks.TensorBoard(
  log_dir=logdir, historgram_freq=1)
cm_callback = keras.callbacks.LambdaCallback(on_epoch_end=log_confusion_matrix)

model.fit(..., callbacks=[tensorboard_callback, cm_callback])
Organizing model development
- Search through & visualize all experiments
- Organize into something digestible
- Make data shareable and accessible
- Tag and add notes that will be more meaningful
Tooling for Teams
Vertex TensorBoard
- Managed service with enterprise-grade security, privacy, and compliance
- Persistent, shareable link to you experiment dashboard
- Searchable list of all experiments in a project
Experiments are iterative in nature
- Creative iterations for ML experimentation
- Define a baseline approach
- Develop, implement, and evaluate to get metrics
- Asses the results, and decide on next steps
- Latency, cost, fairness, GDPR, etc.
- Experiment Tracking
Experiment
Experiment Tracking
Learn more about experiment tracking by checking this two resources out:
Introduction to MLOps
Data Scientists vs Software Engineers
Data Scientists
- Often work on fixed datasets
- Focused on model metrics
- Prototyping on Jupyter notebooks
- Expert in modeling techniques and feature engineering
- Model size, cost, latency, and fairness are often ignored
Software Engineers
- Build a product
- Concerned about cost, performance, stability, schedule
- Identify quality through customer satisfaction
- Must scale solution, handle large amounts of data
- Detect and handle error conditions, preferably automatically
- Consider requirements for security, safety, fairness
- Maintain, evolve, and extend the product over long periods
Growing Need for ML in products and Services
- Large datasets
- Inexpensive on-demand compute resources
- Increasingly powerful accelerators for ML
- Rapid advances in many ML research fields (such as computer vision, natural language understanding, and recommendation systems)
- Business are investing in their data science teams and ML capabilities to develop predictive models that can deliver business value to their customers
Key problems affecting ML efforts today
We've been here before
- In the 90s, Software Engineering was siloed
- Weak version control CI/CD didn't exist
- Software was slow to ship; now it ships in minutes
- Is that ML today?
Today's perspective
- Models blocked before deployment
- Slow to market
- Manual Tracking
- No reproducibility or provenance
- Inefficient collaboration
- unmonitored models
Bridging ML and IT with MLOps
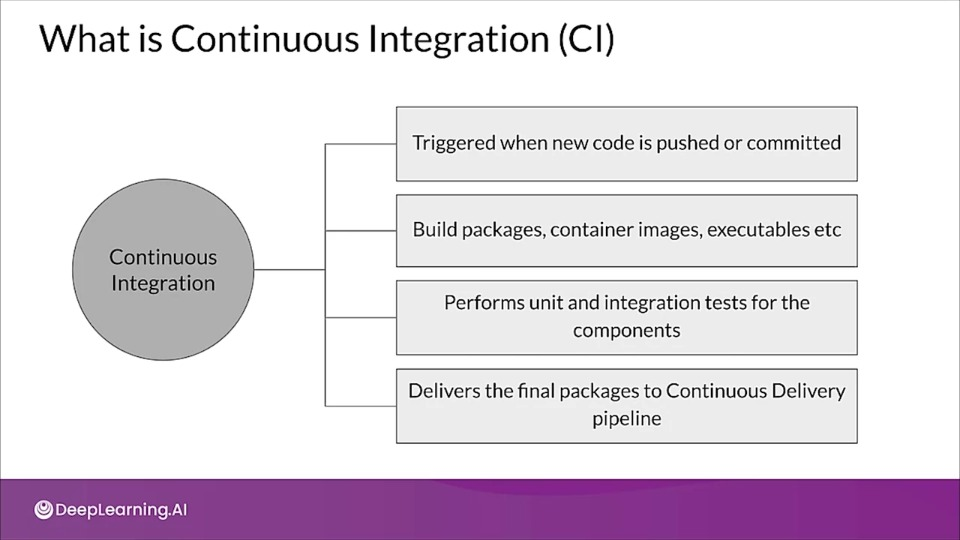
- Continuous Integration (CI): Testing and validating code, components, data, data schemas, and models
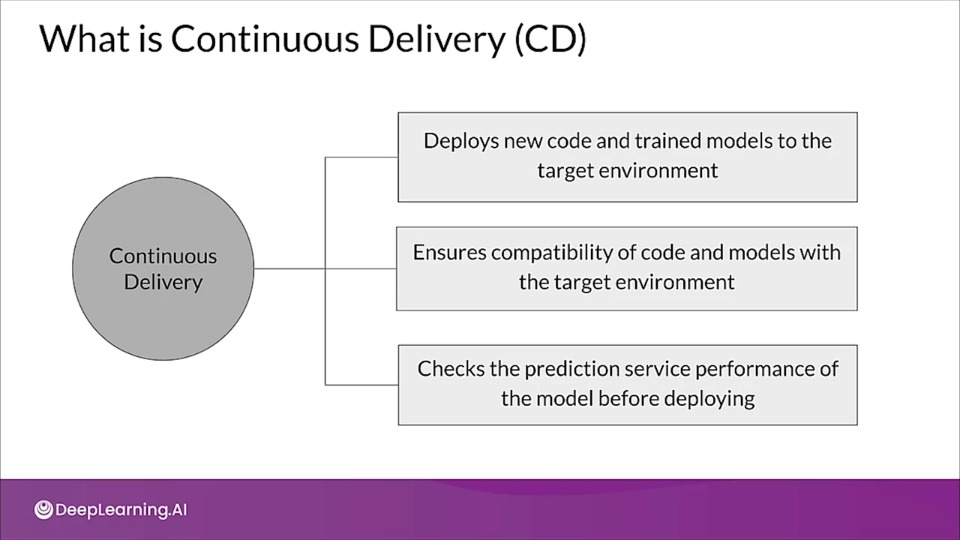
- Continuous Delivery (CD): Not only about deploying a single software package or a service, but a system which automatically deploys another service (model prediction service)
- Continuous Training (CT): A new process, unique to ML systems, that automatically retrains candidate models for testing and serving
- Continuous Monitoring (CM): Catching errors in production systems, and monitoring production inference data and models performance metrics tied to business outcomes.
ML Solution Lifecycle
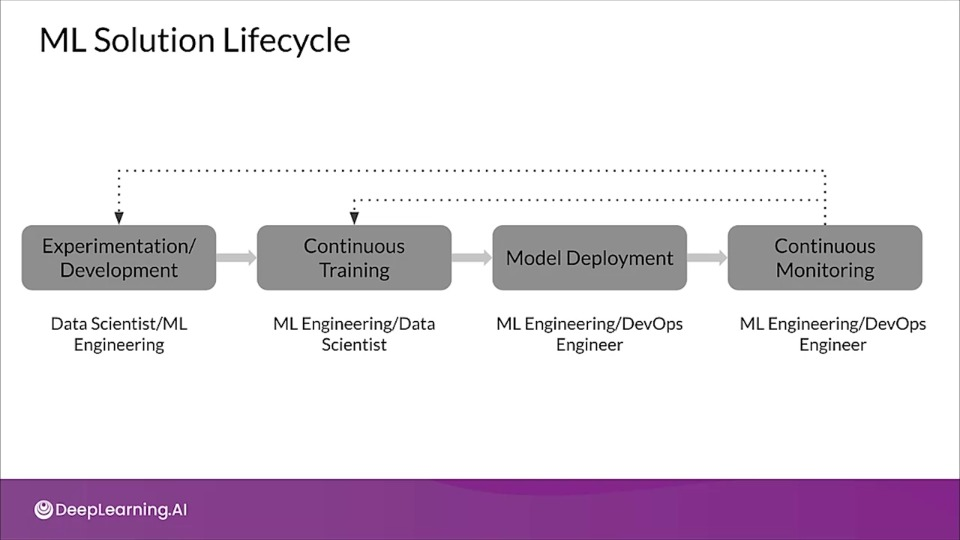
Standardizing ML processes with MLOps
- ML Lifecycle Management
- Model Versioning & iteration
- Model Monitoring and Management
- Model Governance
- Model Security
MLOps Methodology
MLOps Level 0
What defines an MLOps process' maturity?
- The level of automation of ML pipelines determines the maturity of the MLOps process
- As maturity increases, the available velocity for the training and deployment of new models also increases
- Goal is to automate training and deployment of ML models into the core software system, and provide monitoring.
MLOps level 0: Manual process
The process of developing and deploying the model is manual. This creates a disconnect between the ML and operations teams. It also leads to the possibility of training serving skew.
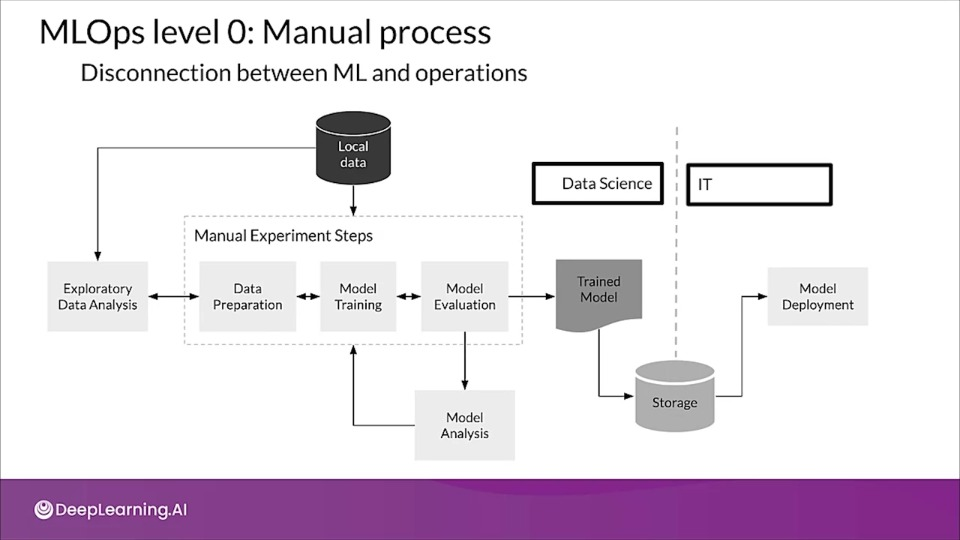
A new model version is probably only deployed a couple of times a year, so because of fewer code changes Continuous Integration (CI) and often even unit testing is totally ignored.
A level 0 process is concerned only with deploying the trained model as a prediction service. Also we do not tracking and logging the model predictions and actions which are required for detecting model degradation and other model behavioral drifts
Challenges for MLOps level 0
- Need for actively monitoring the quality of your model in production
- Retraining your production models with new data
- Continuously experimenting with new implementation to improve the data and model
MLOps Levels 1&2
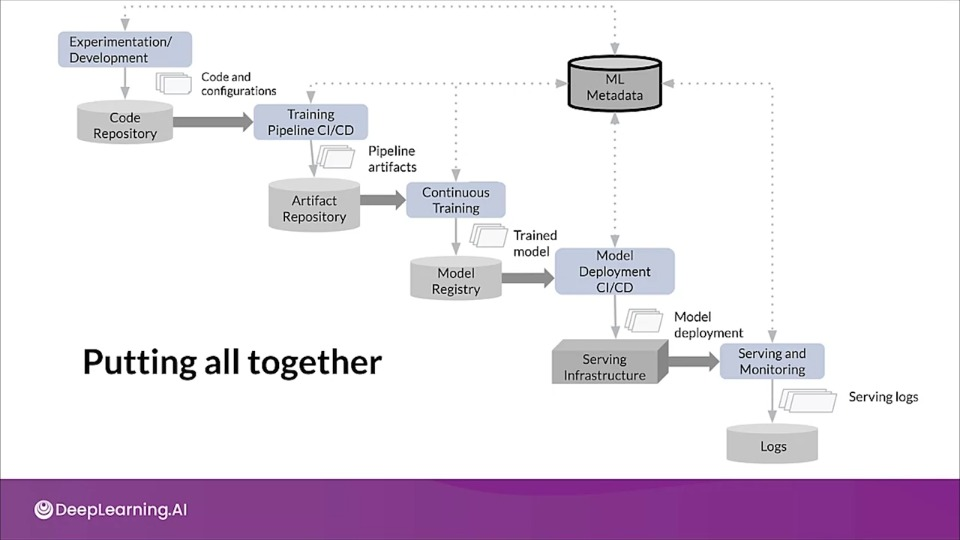
MLOps level 1: ML pipeline automation
One of the main goal of level one is to perform continuous training of the model.
That requires the need to introduce automated data and model validation steps to the pipeline as well as pipeline triggers and metadata management.
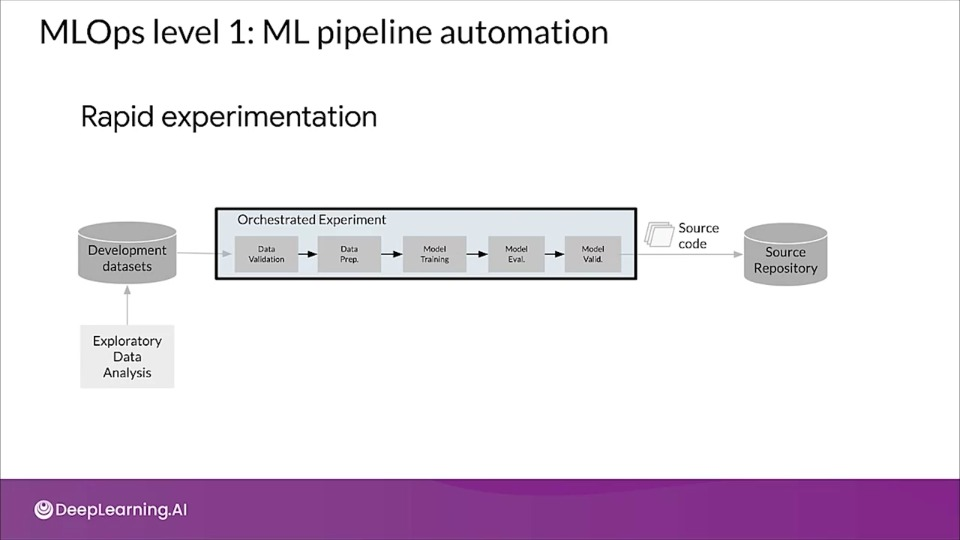
- Notice how the transition from one step to another in the experiment orchestration is automated.
- Models are automatically retrained using fresh data based on live pipeline triggers.
- The pipeline implementation that is used in the development or experimentation is also used in the pre-production and production environment.
- The components need to be modularized, ideally be containerized.
- An ML pipeline in production continuously delivers new models that are trained on new data to prediction services
- Compared to level 0 where we where just deploying the model, here we are deploying the whole training pipeline, which automatically and recurrently runs to serve the trained model.

- When we deploy the pipeline to production, one or more of the triggers automatically executes the pipeline.
- The pipeline expects a new live data to produce a new model version that is trained on the new data. So automated data validation & model validation steps are required in ML pipelines.
-
Whether you should retrain the model, or stop the execution of the pipeline:
This decision is automatically made only if the data is deemed valid. Like data schema mismatch are considered anomalies, in that case the pipeline execution should be stopped and notification should be raised for the team to investigate.
-
Model validation and evaluation of the model is done before promoting the model to production.
The newly trained model needs to be assessed on a test data and then comparing the evaluation metric produced by newly trained model with current model in production.
Also the performance needs to be consistent on different slices of data.
-
In addition to offline model validation, a newly deployed model undergoes online model validation in either a canary deployment or an AB testing setup during the transition to serving prediction for the online traffic.
- Feature Store: A feature store is a centralized repository where you standardize the definition, storage, and access of features for training and serving.
- A feature store also lets you rediscover and reuse available feature sets instead of recreating the same or similar feature sets, avoiding having similar features that have different definition by maintaining features and their related metadata.
- Metadata store: This is where information about each execution of the pipeline is recorded in order to help with data and artifact lineage, reproducibility, and comparisons. This can help us debug errors and anomalies. In case of an interruption, it also allows you to resume execution seamlessly.
MLOps level 2: CI/CD pipeline automation
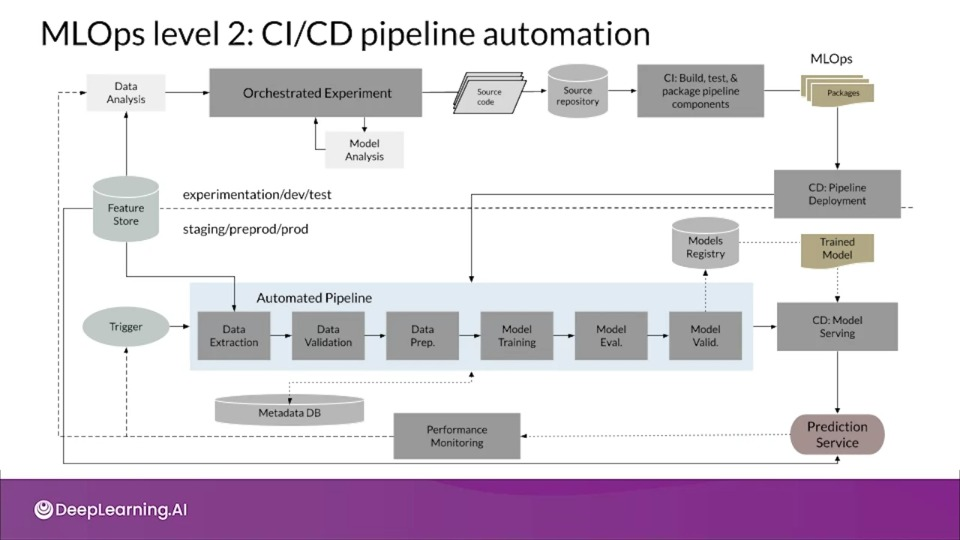
The truth is that at the current stage of the development of MLOps best practices, level two is still somewhat speculative
The diagram presents on of the current architectures, focused on enabling rapid and reliable update of the pipelines in production.
MLOps Resources
MLOps Resources
If you want to learn more about MLOps check this blog out, and visit this curated list of references for more information, ideas, and tools.
Developing Components for an Orchestrated Workflow
- Pre-built and standard components, and 3 styles of custom components
- Components can also be containerized
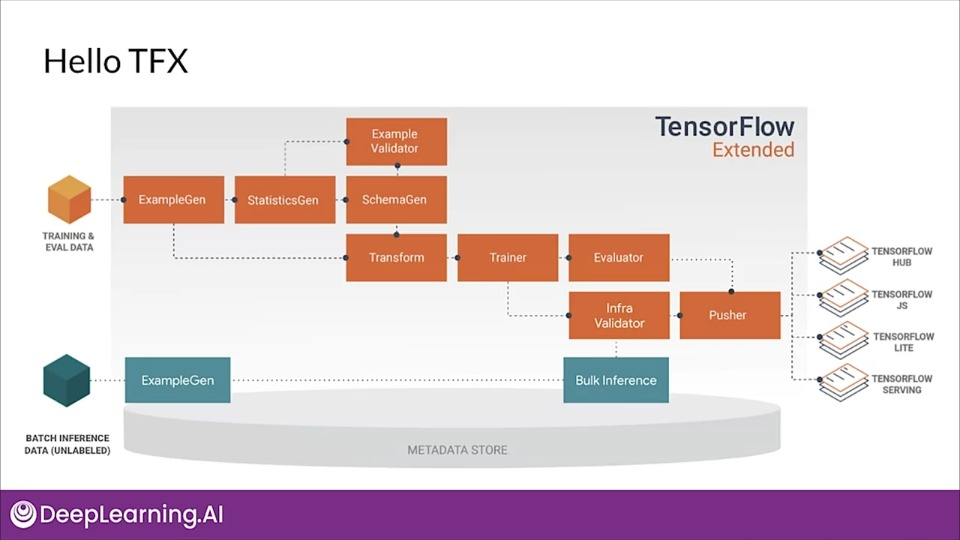
- Examples of thing you can do with TFX components:
- Data augmentation, upsampling, or downsampling
- Anomaly detection based on confidence intervals or autoencoder reproduction error
- Interfacing with external systems like help desks for alerting and monitoring and more...
Anatomy of a TFX component
Components are essentially composed of a component specification and executor class packaged inside a component class.
Component specification
- The component's input and output contract and parameters used for component execution.
Executor class
- Provides the implementation for component's processing
Component Class
- Combines the component specification with the executor to create a TFX component
TFX components at runtime
When a pipeline runs a TFX component the component is executed in three phases:
- The driver uses the component specification to retrieve the required artifacts form the metadata store and pass them into the component.
- The executor perform the components work
- The publisher uses the component specification and the results from the executor to store the components, output in the metadata store.
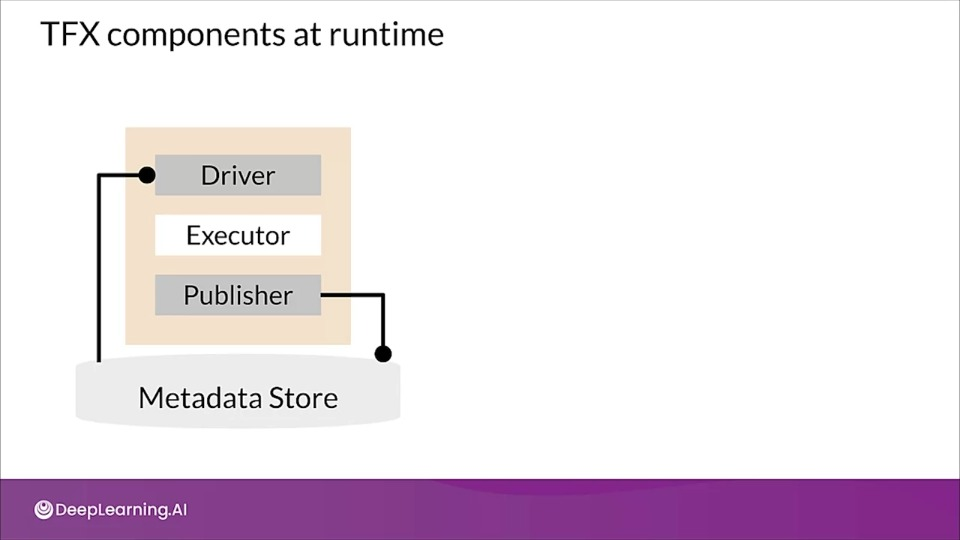
Custom components only requires modification to executor class. Modification to the driver or publisher should only be necessary if we want to change the interaction between pipeline's components and the metadata store
If we want to change the inputs, outputs or parameters for your component, we only need to modify the component specification.
Types of custom components:
-
Python function based custom components
Only require Python function for the executor with a decorator and argument annotations.
-
Container based custom components
Provide the flexibility to integrate code written in any language into your pipeline by wrapping the components inside a Docker container.
-
Fully custom components
Fully custom components lets us build components by defining the component specification, executor and component interface classes.
Python function-based components
In this style you write a function that is decorated and annotated with type hints.
The type hints describe the InputArtifacts , OutputArtifacts, parameters of your component.
@component
def MuValidationComponent(
  model: InputArtifact[Model],
  blessing: OutputArtifact[Model],
  accuracy_threshold: Parameter[int] = 10,
  ) -> OutputDict(accuracy=float):
  '''My simple custom model validation component.'''

  accuracy = evaluate_model(model)
  if accuracy >= accuracy_threshold:
    write_output_blessing(blessiing)

  return {
    'accuracy': accuracy
  }
Container-based components
To create one we need to specify a Docker container image that includes our component dependencies.
from tfx.dsl.component.experimental import container_component, placeholders
from tfx.types import standard_artifacts

grep_component = container_component.create_container_component(
  name='FilterWithGrep',
  inputs={'text': standard_artifacts.ExternalArtifact},
  outputs={'filtered_text': standard_artifacts.ExternalArtifact},
  parameters={'pattern': str},
  ...
  image='google/cloud-sdk:278.0.0',
  command=[
    'sh', '-exec',
    ...
    ...
    '--pattern', placeholders.InputValuePlaceholder('pattern'),
    '--text', placeholders.InputUriPlaceholder('text'),
    '--filtered-text',
    placeholders.OutputUriPlaceholder('filtered_text'),
  ],
)
Their are other parts of the configuration like container image name and optionally the image tag. For the body of the component we can have command parameter which defines the container entry point command line. The command line can use placeholder objects that are replaced at compilation time with the input, output or parameters.
Fully custom components
- Define custom component spec, executor class, and component class
- Component reusability
- Reuse a component spec and implement a new executor that derives from an existing component
Defining input and output specifications
These inputs and outputs are wrapped in channels, essentially dictionaries of typed parameters for input and output artifacts.
The PARAMETERS is a dictionary of additional execution parameter items that are passed into the executor and are not metadata artifacts.
class HelloComponentSepc(types.ComponentSpec):
  INPUTS = {
    # This will be a dictionary with input artifacts, including URIs
    'input_data': ChannelParameter(type=standard_artifacts.Examples),
  }
  OUTPUTS = {
    # This will be a dictionary which this component will populate
    'output_data': ChannelParameter(type=standard_artifacts.Examples),
  }
  PARAMETERS = {
    # These are parameters that will be passed in the call to create
    # an instance of this component
    'name': ExecutionParameter(type=Text),
  }
Implement the executor
class Executor(base_executor.BaseExecutor):
  def Do(self, input_dict: Dict[Text, List[type.Artifact]],
          output_dict: Dict[Text, List[types.Artifact]],
          exec_properties: Dict[Text, Any]) -> None:
    ...
    split_to_instances = {}
    for artifact in input_dict['input_data']:
      for split in json.loads(artifacts.split_names):
        uri = os.path.join(artifact.uri, split)
        split_to_instance[split] = uri
    for split, instance in split_to_instance.items():
      input_dir = instance
      output_dir = artifact_utils.get_split_uri(
                      output_dict['output_data'], split)
    for filename in tf.io.gfile.listdir(input_dir):
      input_uri = os.path.join(input_dir, filename)
      output_uri = os.path.join(output_dir, filename)
      io_utils.copy_file(src=input_uri, dst=output_uri, overwrite=True)
Make the component pipeline-compatible
from tfx.types import standard_artifacts
from hello_component import executor

class HelloComponent(base_component.BaseComponent):
    SPEC_CLASS = HelloComponentSpec
    EXECUTOR_SPEC = ExecutorClassSpec(executor.Executor)

    def __init__(self,
      input_data: types.Channel = None,
      output_data: types.Channel = None,
      name: Optional[Text] = None):
      if not output_data:
        examples_artifact = standard_artifacts.Examples()
        examples_artifact.split_names = input_data.get()[0].split_names
        output_data = channel_utils.as_channel([examples_artifact])

      spec = HelloComponentSpec(input_data=input_data, output_data, name=name)
      super(HelloComponent, self).__init__(spec=spec)
Assemble into a TFX pipeline
def _create_pipeline():
  ...
  example_gen = CsvExampleGen(input_base=examples)

  hello = component.HelloComponent(
    input_data=example_Gen.outputs['examples'],
    name='HelloWorld')

  statistics_gen = StatisticsGen(
    examples=hello.outputs['output_data'])
  ...
  return pipeline.Pipeline(
    ...
    components=[example_gen, hello, statistics_gen, ...],
    ...
  )
Architecture for MLOps using TFX, Kubeflow Pipelines, and Cloud Build
Architecture for MLOps using TFX, Kubeflow Pipelines, and Cloud Build
To learn more about MLOps using TFX please check this document out.
Model Management and Deployment Infrastructure
Managing Model Versions
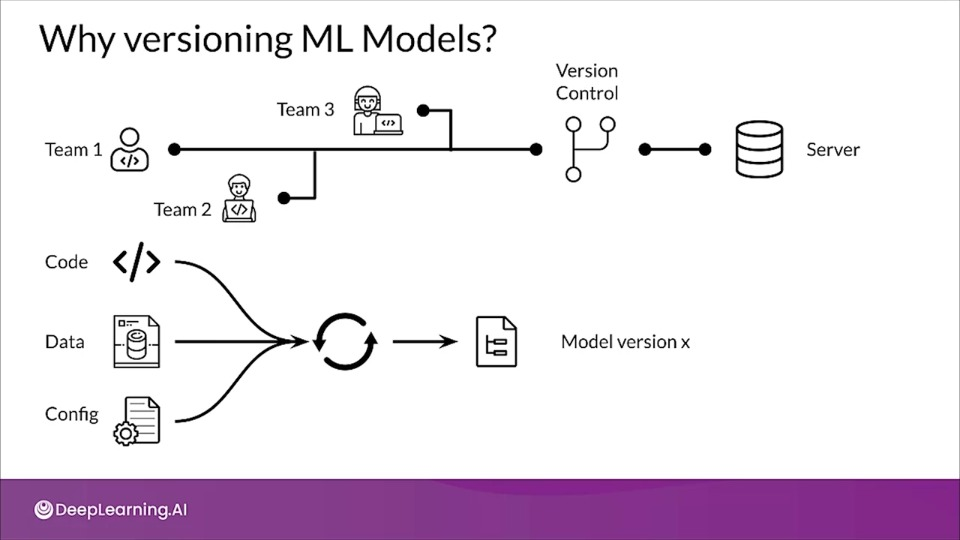
Why versioning ML Models?
In normal software development, teams and individual rely on version control software to help teams manage and control changes to their code. This helps them stay in sync with each other, rollback if new changes cause havoc and assess their development.
Similarly in ML model development, model versioning helps teams keep track of changes to code, data and configs to properly reproduce the results and do collaboration.
How ML Models are versioned?
How software is versioned
Version: MAJOR.MINOR.PATCH
MAJOR: Contains incompatible API changesMINOR: Adds functionality in a backwards compatible mannerPATCH: Makes backwards compatible bug fixes.
ML models versioning
- No uniform standard accepted yet
- Different organizations have different meanings and conventions
A Model Versioning Proposal
Version: MAJOR.MINOR.PIPLEINE
Major: Incompatibility in data or target variableMINOR: Model performance in improvedPIPELINE: Pipeline of model training is changed
TFX uses pipeline execution versioning. In this style, a new version is defined with each successfully run training pipeline. Models will be versioned regardless of changes to model architecture, input, or output.
Retrieving older models
- Can ML framework be leveraged to retrieve previously trained models?
- ML framework may internally be versioning models
What is model lineage?
Model lineage is a set of relationships among the artifacts that resulted in the trained model.
Artifacts
Artifacts are information needed to preprocess data and generate result (code, data, config, model)
To build model artifacts, you have to be able to track the code that build them and the data including pre-processing operations that the model was trained and tested upon.
ML orchestration frameworks (like TFX) may store operations and data artifacts to recreate model. Model lineage usually only includes those artifacts and operations that were part of model training. Post-training artifacts and operations are usually not part of the lineage.
What is model registry?
A model registry is a central repository for storing trained models.
- Provides various operations of ML model development lifecycle
- Promotes model discovery, model understanding, and model reuse
- Integrated into OSS and commercial ML platforms
Metadata stored by model registry
Metadata usually includes:
- Model versions
- Model serialized artifacts
- Free text annotations and structured properties.
- Links to other ML artifact and metadata stores
Capabilities Enabled by Model Registries
- Model search/discovery and understanding
- Approval/Governance
- Collaboration/Discussion
- Streamlined deployments
- Continuous evaluation and monitoring
Examples of Model Registries
- Azure ML Model registry
- SAS model manager
- MLflow Model Registry
- Google AI platform
- Algorithmia
-
ML Model Management
ML Model Management
Take a deeper dive into managing ML model versions by checking this blog out.
Continuous Delivery
Continuous Delivery helps promotes robust deployment.
What is Continuous Integration (CI)
What is Continuous Delivery (CD)
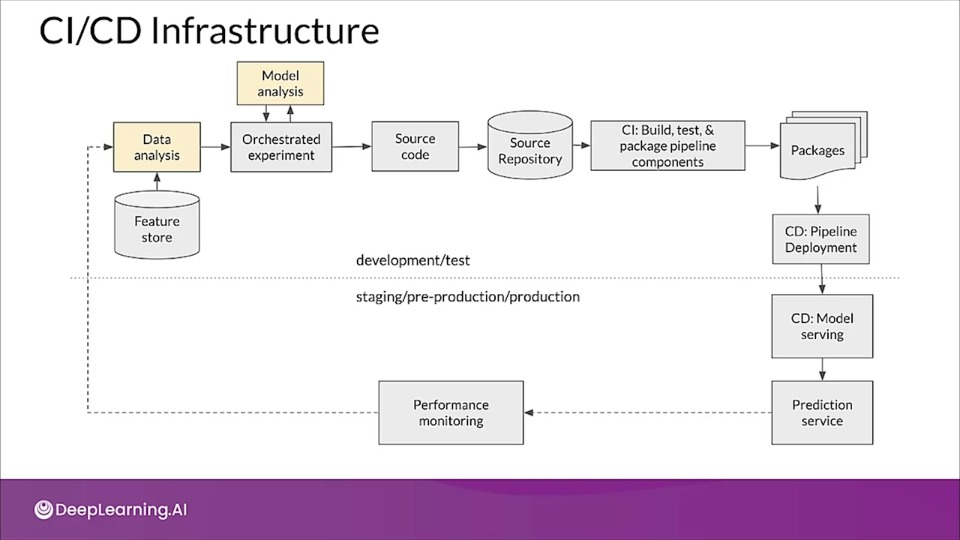
CI/CD Infrastructure
Unit Testing in CI
In unit test we test each component in the pipeline produces the expected artifacts
In addition to unit testing our code, following the standard practices of software development, there are two additional types of unit tests when doing CI for ML:
- Unit testing Data
- Unit testing Model performance
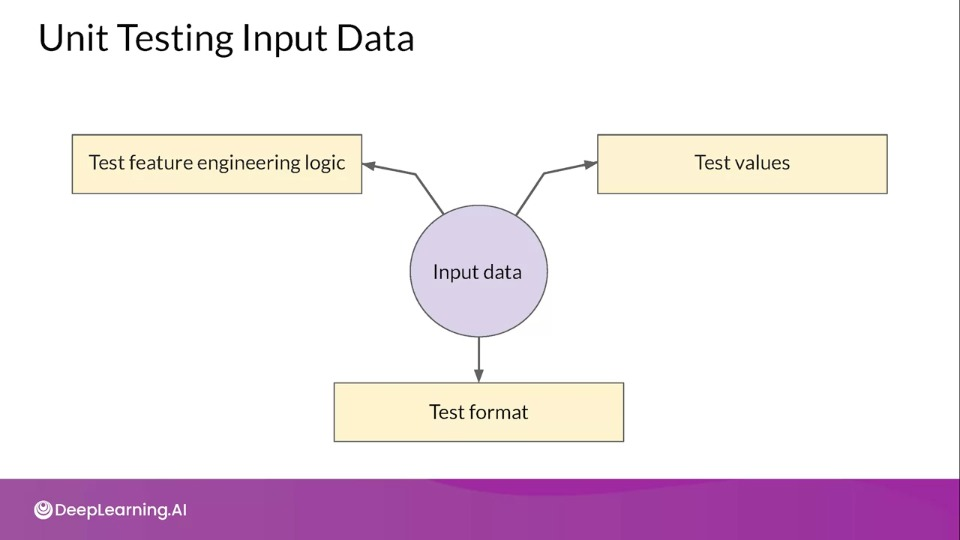
Unit Testing Input Data
Unit testing of data is not the same as performing data validation on your raw features.
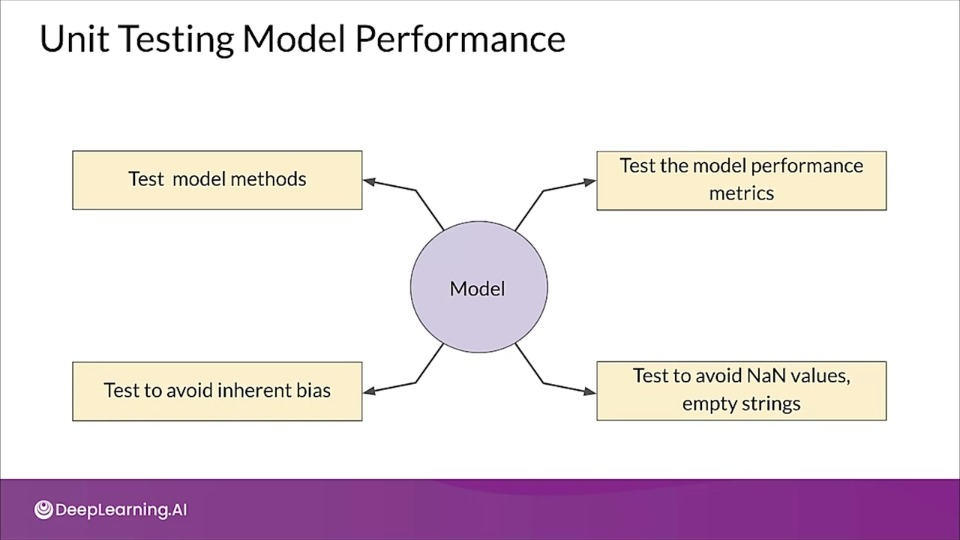
Unit Testing Model performance
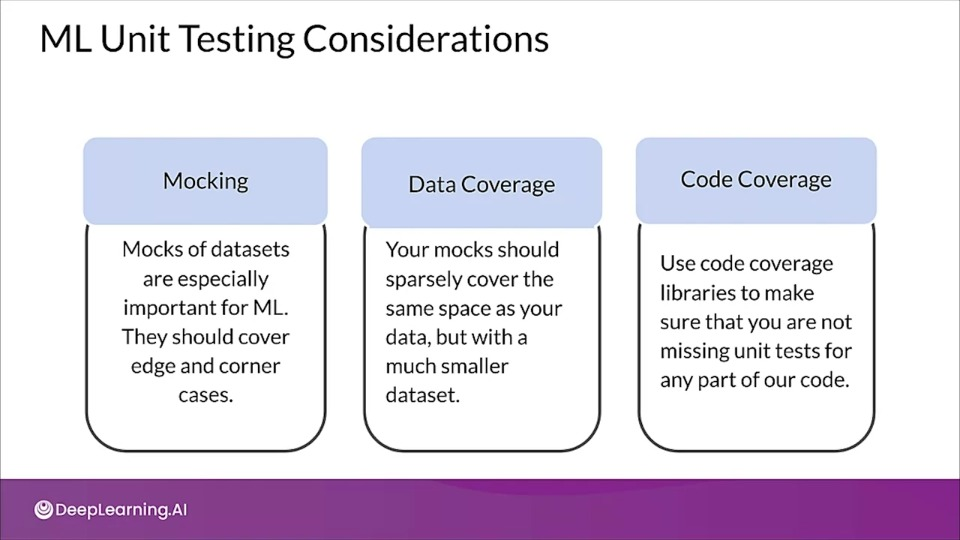
ML Unit Testing Considerations
Infrastructure validation
Infrastructure validation acts as an early warning layer before pushing a model into production to avoid issues with models that might nor run or might perform badly when actually serving requests in production.
When to apply infrastructure validation
- Before starting CI/CD as part of model training
- Can also occur as part of CI/CD as a last check to check to verify that the model is deployable to the serving infrastructure.
TFX InfraValidator
- TFX InfraValidator takes the model, launches a sand-boxed model server with the model and sees if it can be successfully loaded and optionally queried
- InfraValidator is using the same model server binary, same resources, and same server configuration as production.
- InfraValidator only interacts with the model server in the user configured environment to see of it works as expected. Configuring this environment correctly will ensure that your inferred validation passing or failing will be indicative of whether the model would be survivable in the production serving environment.
Continuous Delivery
Continuous Delivery
Explore this website to learn more about continuous delivery.
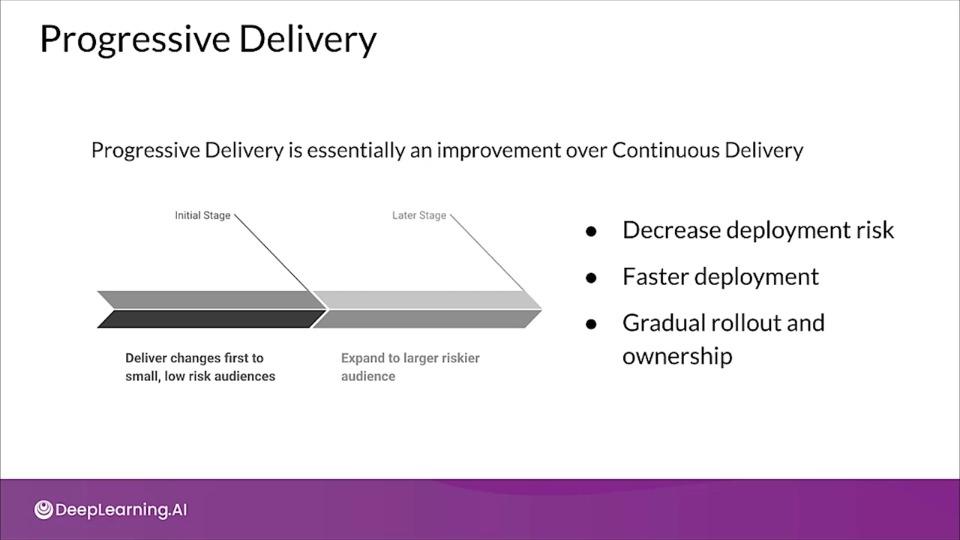
Progressive Delivery
Progressive Delivery is essentially an improvement over Continuous Delivery.
Complex Model Deployment Scenarios
Progressive delivery usually involves having multiple versions deployed at the same time so that comparisons in performance can be made
- You can deploy multiple models performing same task
- Deploying competing models, as in A/B testing
- Deploying as shadow models, as in Canary testing
Blue/Green deployment
Traffic is passing through the load balancer directing it to current live environment called Blue. Meanwhile a new version is deployed to the green environment which acts as a staging setup where a series of tests are conducted to ensure performance and functionality.
After passing the tests the traffic is then directed to the green deployment. If problem arises traffic can be moved back to the Blue version.
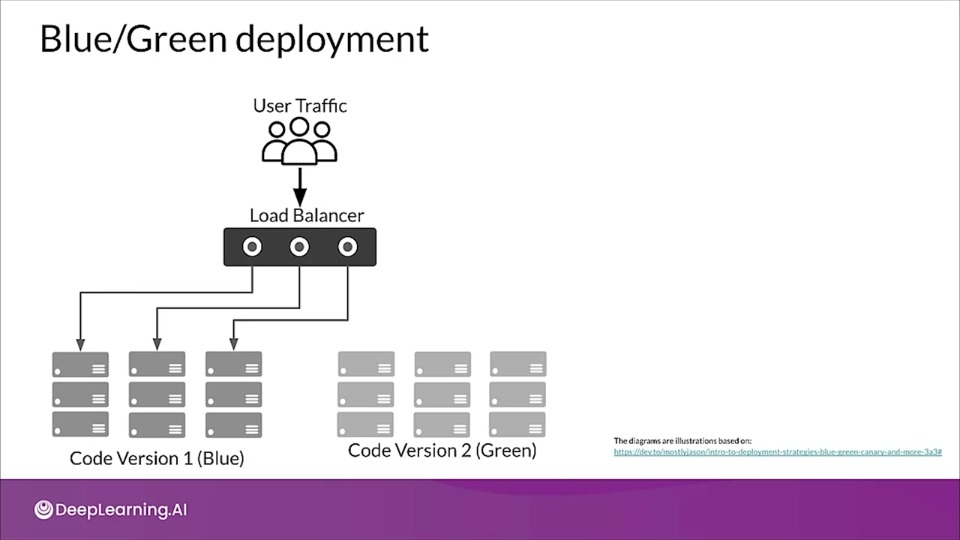
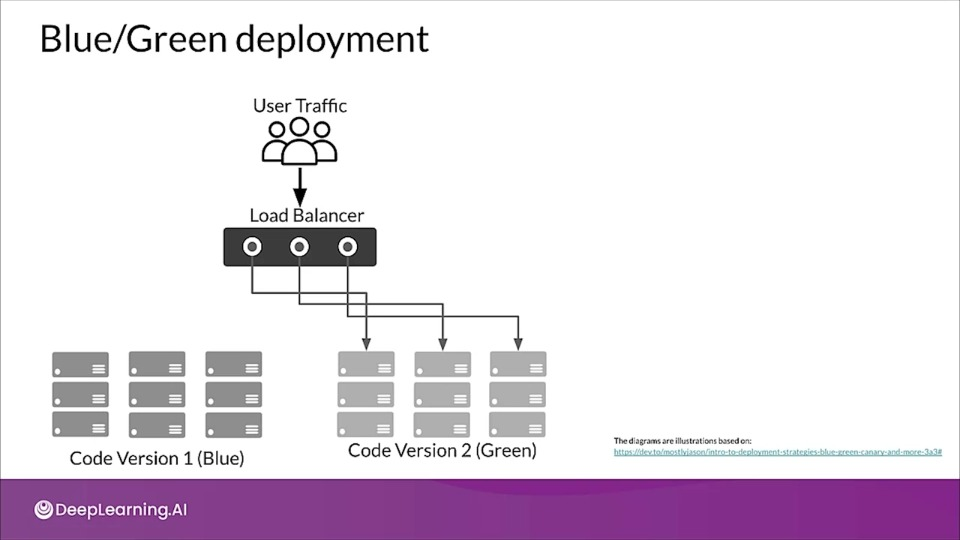
- No Downtime
- Quick rollback & reliable
- Smoke testing in production environment
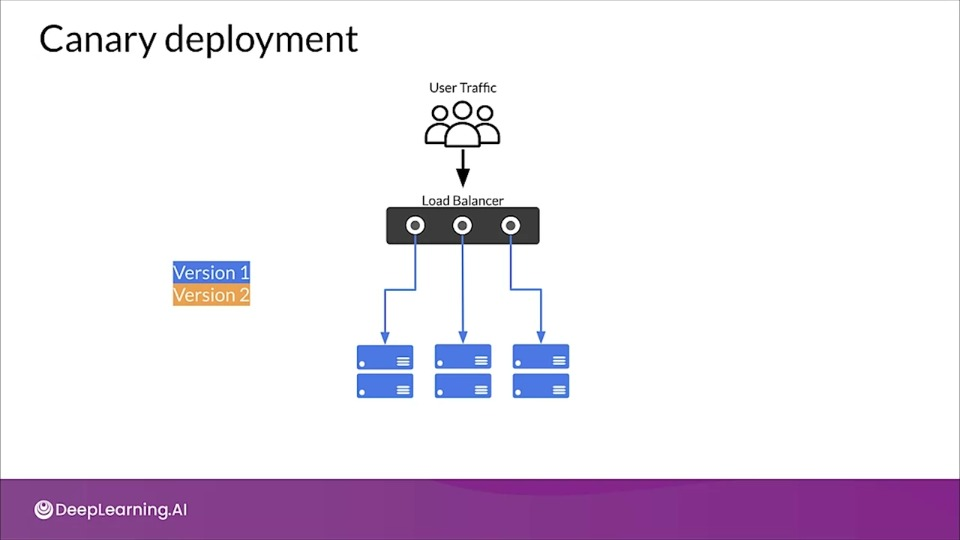
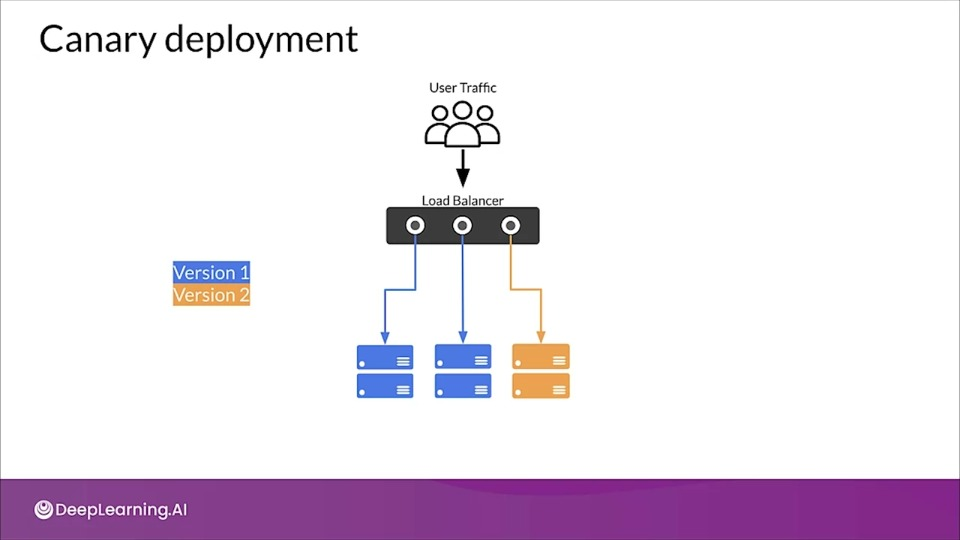
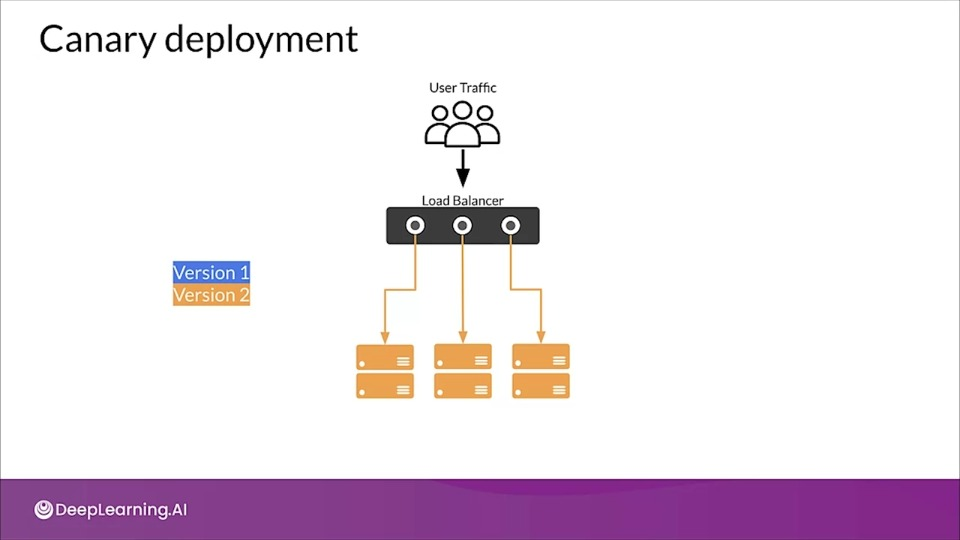
Canary deployment
Similar to blue/green deployment, but instead of switching the entire incoming traffic from blue to green all at once, traffic is switched gradually.
As traffic begins consuming new version, the performance of the new version is monitored. If necessary the deployment can be stopped and reversed with no downtime and minimal exposure of user to new version.
Eventually all traffic is transferred to the new version.
Live Experimentation
- Model metrics are usually not exact matches for business objectives
- Examples: Recommender systems
- Model trained on clicks
- Business wants to maximise profit
- Example: Different products have different profit margins
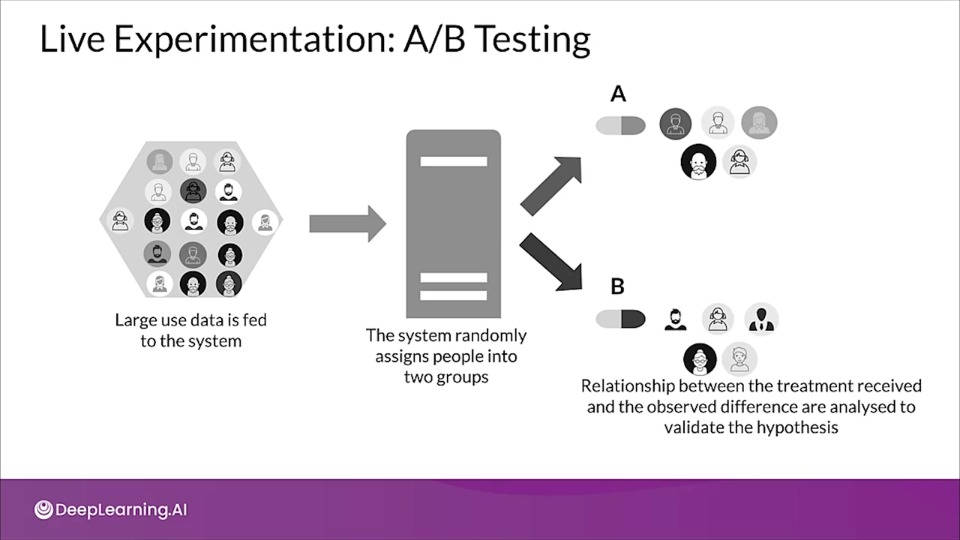
Live Experimentaion:; A/B Testing
In A/B testing we have at least two different models (or n) and we compare the business results between them to select the model that gives the best business performance.
- Users are divided into two groups
- Users are randomly routed to different models in environment
- You gather business results from each model to see which one is performing better
Progressive Delivery
Progressive Delivery
Explore more about progressive delivery with Kubernetes operators allowing for minimum downtime and easy rollbacks in this documentation.